Test

Actionable Science
Conducting interdisciplinary research to address complex weather and disaster-related societal challenges

Geospatial Analytics
Developing new methods, workflows, and analytical frameworks to explore complex interdisciplinary questions

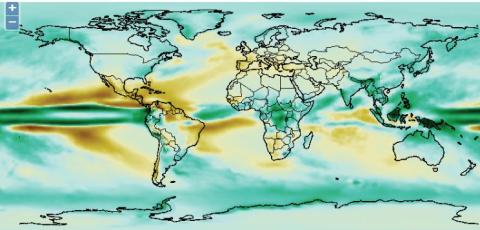
Geovisualizations
Creating innovative data visualizations at the intersection of climate, weather and society
Geospatial Data and Tools
Providing weather and climate data for GIS applications and tools to facilitate the use of NCAR’s models
Tutorials
Free tutorials teach GIS concepts and tools using weather and climate data

Interoperability
Connecting atmospheric and geospatial data and systems
Climate Inspector
The Climate Inspector is an interactive web application which expands GIS mapping and graphing capabilities to visualize possible temperature and precipitation changes throughout the 21st century.
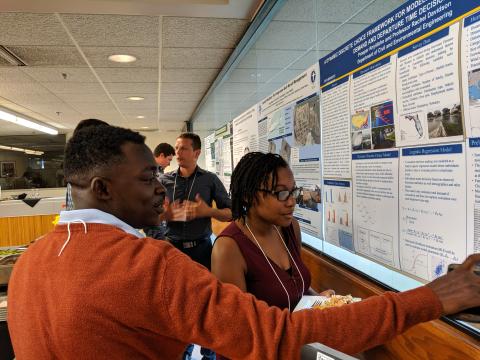
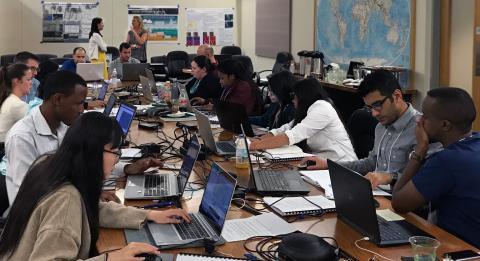
Workshops
Hands-on Training and Education
Climate Inspector
The Climate Inspector is an interactive web application which expands GIS mapping and graphing capabilities to visualize possible temperature and precipitation changes throughout the 21st century.
Climate Scenarios
Climate Change Scenarios GIS portal serves a large community of GIS users. Global and downscaled climate change projections from the Community Climate System Model (CCSM4) can be downloaded in a common GIS format.

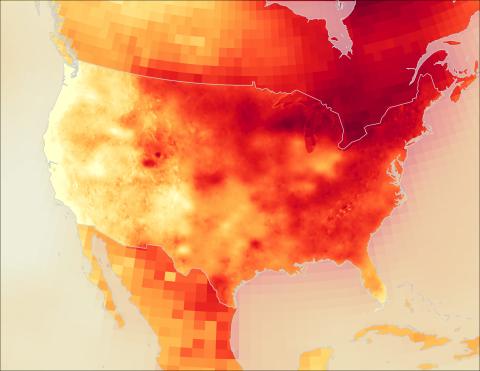
Extreme Heat Climate Inspector
Extreme Heat Climate Inspector is an interactive web application to visualize possible changes in extreme heat in the future.