Flooding on streets.

Examining the roles of visualizations in people’s understanding of uncertain storm surge forecasts

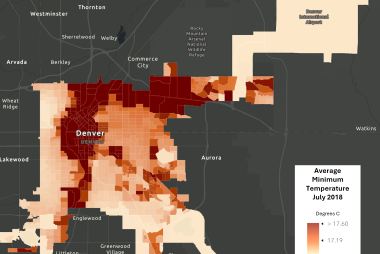
A new study published in The International Journal of Disaster Risk Reduction explores how different aspects of geospatial visualization influence individuals' understanding and relatability of storm surge information.

More

Data and Tools

Climate Inspector

Explore climate anomalies, variability, and uncertainty in space and time.

Extreme Heat Climate Inspector

Visualize future scenarios of extreme heat.

Climate Change Scenarios

Download the latest NCAR Community Earth System Model (CESM) CMIP6 climate change projections in GIS formats.

Air Quality Dashboard

Explore past modeled annual concentration trends of air quality over the continental US.

Agriculture and Air Pollution Dashboard

Explore spatial patterns of ozone exposure measurements tied to agricultural health.

Air Quality Index Dashboard

Download air-quality data as a CSV file from the CMAQ model, aggregated spatially and temporally.