Three new dashboard tools to visualize air quality
Agile ways to view trends or just snapshots in time

NCAR GIS just released three new interactive visualization tools that illustrate air quality across a variety of modalities. These tools have been developed as dashboards that elegantly facilitate the end-user experience making it easy to understand trends and patterns in the data.

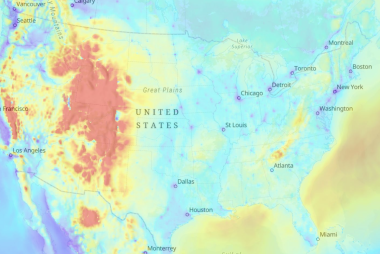
The Air Quality Dashboard displays modeled air quality (Congestion Mitigation and Air Quality [CMAQ]) for U.S. states and counties. The available data are for Ozone, NO2, PM1, PM2.5 and PM10. This information can be used to discern whether local air-quality policies have had any positive impact. For example, you might view Los Angeles county to study the downward trend in levels of ozone and PM over the years after local county governments implemented new air quality policy. Or you might discover how large wildfire years have affected air quality. If you view Shasta County in California you'll see the spikes of high PM and Ozone that correlated to big wildfire years.
Take this information a step farther with the Agriculture and Air Pollution Dashboard. It's commonly known that air quality has a dramatic effect on agricultural production. This tool includes additional variables related to vegetation health. Now you can study trends in the agricultural food-supply chain that may have been damaged by poor air quality events.
And, there's another! The Air Quality Index Dashboard takes the visualizations rendered by the Air Quality Dashboard to the next level. If users are curious about the trends they observed in the Air Quality Dashboard, they can use this tool to download that data. Using Open Source Python Streamlite technology, this dashboard lets users spatially and temporally aggregate air-quality variables from the CMAQ model, downloaded as .cvs, and at a finer temporal resolution! The .csv data can then incorporated be into researchers' modeling tools for further analysis.
Air-quality trends are easier than ever to view and employ for individual research. Users ranging from local safety managers to food producers to healthcare now have an agile, elegant way to inform their disciplines.